


Data Provided by: NCEI; the National Centers for Environmental Information
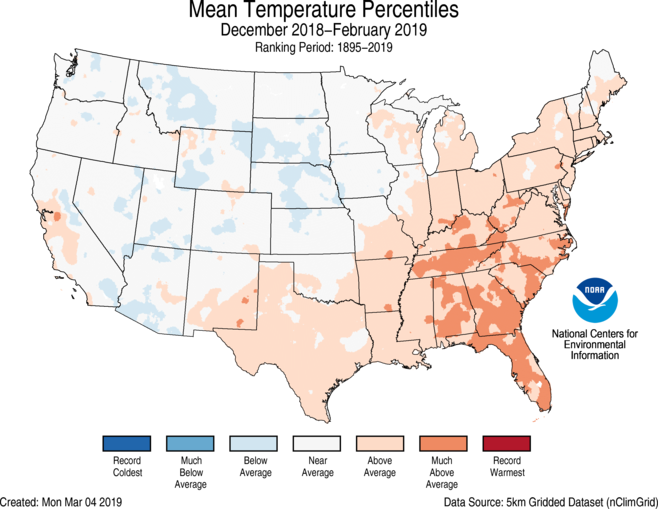
Meteorologists generally categorize winter into 3 months: December, January, and February; with “meteorological winter” beginning on December 1st and ending on February 28th (or 29th if a leap year of course). These months are generally the coldest months of the year for the United States and therefore cited as the period of which the highest heating demand is needed throughout the country.
Heating demand is usually associated with heating degree days. A heating degree day, or HDD for short, is a measurement designed to quantify the demand for energy needed to heat a building. In the United States, a HDD is calculated by determining how far off that day’s average temperature is below 65 degrees Fahrenheit which is the temperature below which buildings need to be sufficiently heated to maintain an average temperature of around 70 degrees. These values can obviously vary based on the building and the type of insulation inside but a standard base value temperature of 65 is used to determine HDD. Colder regions during the winter in the US such as the Northern Plains will see significantly more HDD as opposed to Florida where the overall amount of HDD is much less.
Data Provided by: NCEI; the National Centers for Environmental Information
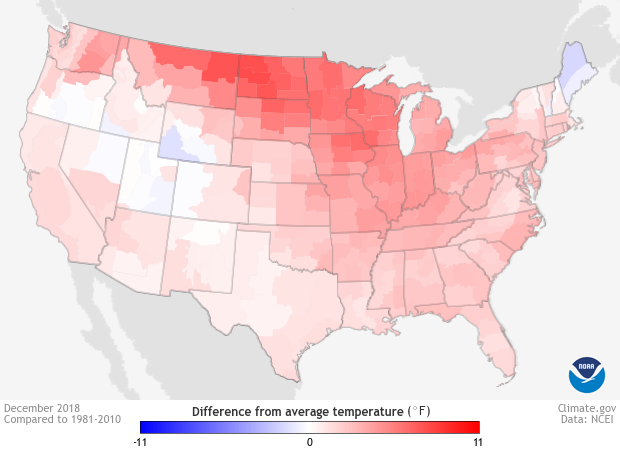
Temperatures in December of 2018, overall for the majority of the United States, were above average with the highest differences in temperature compared to climatology occurring throughout the Northern Plains. According to the National Center for Environmental Information, above average temperatures impacted all but ten of the lower 48 states. No state ranked in the top or bottom ten percent of their history. For December, the average contiguous U.S. temperature was 35.6°F, 2.9°F above the 20th century average, ranking as the 21st warmest in the historical record. In regards to overall heating demand for the month of December, a majority of the United States experienced above average temperatures, leading to less HDD than normal
Data Provided by: NCEI; the National Centers for Environmental Information
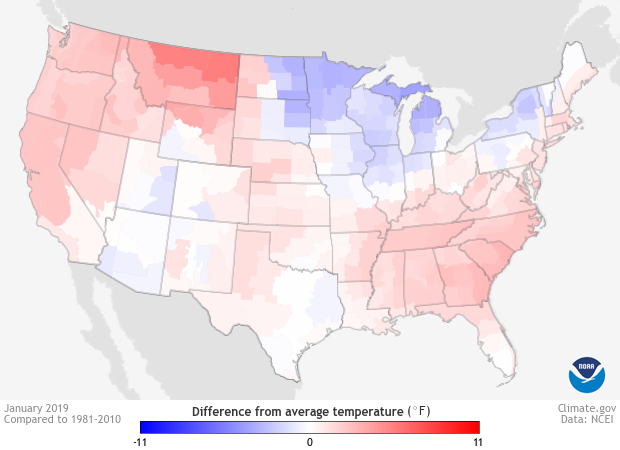
January 2019 temperatures were much similar to those of December 2018 with the key difference being a slight drop below average for the Northern Plains and Upper Midwest. The Pacific Northwest and Southeast most notably remained above average. However; data from the NCEI (National Center for Environmental Information) indicates that in January the average contiguous U.S. temperature was 32.7°F, 2.6°F above the 20th century average, ranking in the warmest third of the 125-year period of record. This would imply that the warmer extremes during the month outweighed the colder extremes that some parts of the country experienced and thus, depending on a given location, less HDD than normal were likely seen.

Data Provided by: NCEI; the National Centers for Environmental Information
Temperatures in February of 2019 on the other hand, took a tumble for a majority of the country with a huge swath of the western and northern parts of the U.S seeing well below normal values. The southeast remained above average but in terms of overall temperatures, the colder extremes outweighed the warm extremes. NCEI data indicates that the average contiguous U.S. temperature during February was 32.0°F, 1.8°F below the 20th century average. This ranked among the coldest third of the 125-year period of record and was the coolest February since 2010. With this data in mind, it can be implied that overall below average temperatures seen in February likely lead to an increase in HDD for the month throughout a majority of the country.
By: Sean Klipple
trueWeather Meteorologist
trueWeather provides 24/7 year-round forecasting, alerting, certification and reporting services for contractors, public works departments, school districts, entertainment venues and more.
trueWeather has a feature-rich weather dashboard tailored to your specific needs – including mobile apps and instant access to our team of meteorologists and much more. Clients trust trueWeather to provide an unbiased view into how weather will directly impact their operations – starting at just $350/annually. Give us a call at (844) 614-1298 to receive a no-hassle instant quote, or email us at directsales@truewx.com.