


Winter 2026–2027 Outlook
A very strong El Niño remains the leading signal for the 2026-2027 winter, while the latest seasonal guidance introduces a Gulf of Alaska trough and eastern Canada blocking pattern that could improve late-winter cold opportunities across the East
ENSO Forecast: Very Strong El Niño
The August update continues to begin with an unusually strong large-scale signal. The latest CCSR/IRI model suite overwhelmingly supports a very strong El Niño for the 2026-2027 winter. The combined all-model forecast peaks near +3.1°C to +3.2°C during the late fall and early winter, remains near +2.8°C during December through February and then gradually weakens into the spring.
That expected strength continues to favor an active southern storm track, a warmer northern tier and fewer routine snowfall opportunities across the Upper Midwest and Great Lakes. It does not, however, determine whether an individual storm produces rain, ice or snow. Those details will depend on shorter-lived atmospheric patterns that control access to cold air, blocking and storm timing.
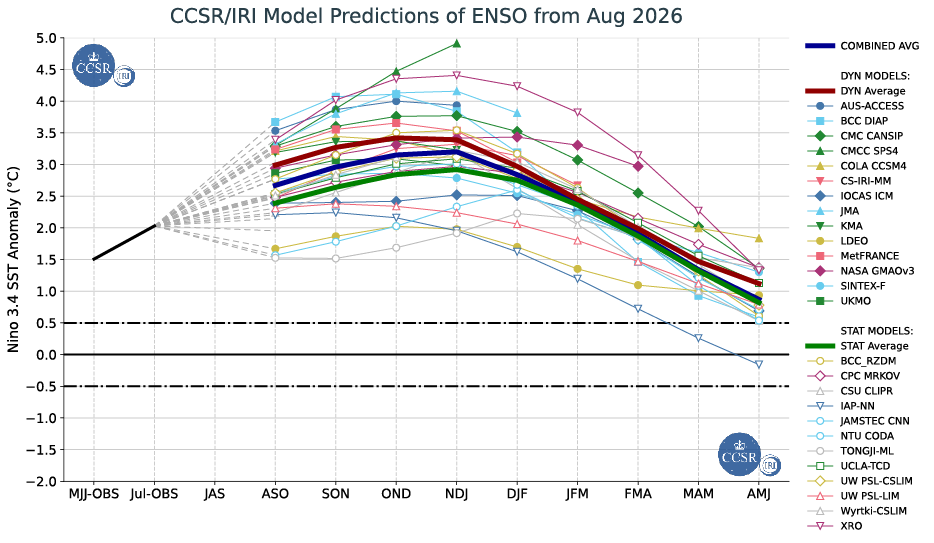
August 2026 dynamical and statistical ENSO model predictions for the Niño 3.4 region. Source: CCSR and the International Research Institute for Climate and Society.
August 2026 ENSO model predictions showing a very strong El Niño favored for the 2026-2027 winter.
KEY CLIMATE DRIVERS
A very strong El Niño typically strengthens and extends the Pacific subtropical jet across the southern United States. The broad seasonal response favors milder conditions across the northern United States and a wetter, more active pattern from California and the Southwest through the Gulf Coast and Southeast.
The strength of the tropical forcing can also produce a faster and flatter west-to-east flow. This is important because a very active southern jet does not automatically lead to more snow. If cold air remains confined farther north or retreats before a storm arrives, the same moisture-rich system can produce rain or ice instead.
The seasonal outlook therefore begins with the El Niño background, but the final snowfall outcome will depend on whether several additional climate signals cooperate:
- Arctic Oscillation, or AO: A negative phase increases the likelihood that Arctic air can reach the central and eastern United States. A positive phase tends to keep the coldest air confined farther north.
- Eastern Pacific Oscillation, or EPO: A negative phase favors an Alaskan ridge and can release colder continental air into central and eastern North America.
- Pacific-North American pattern, or PNA: A positive phase favors a western ridge and eastern trough, improving cold-air delivery into the East. A negative phase raises the risk of a western trough, eastern warmth, and inland storm tracks.
- North Atlantic Oscillation, or NAO: A negative phase can slow and suppress coastal storms. Too much blocking, however, can force a storm too far south.
- Madden-Julian Oscillation, or MJO: This traveling tropical thunderstorm pulse can temporarily reshape the jet stream and influence cold delivery and storm opportunities.
ENSO can provide useful seasonal guidance months in advance. The AO, EPO, PNA, NAO, and MJO cannot be predicted with comparable skill that far ahead. They are more useful as monitoring signals as a potential winter-weather window moves inside roughly two to four weeks.
A LATE-WINTER PATTERN TO WATCH
The most noteworthy change in the August outlook comes from the evolving large-scale pressure pattern shown by both CANSIPS and the ECMWF Seasonal model. Each model strengthens a trough in the Gulf of Alaska as meteorological winter progresses, while higher pressure and blocking become more established across eastern Canada.
A deeper Gulf of Alaska trough can help build warmer southerly flow along the West Coast and western North America. Farther east, the developing Canadian block could make it easier for cooler or below-normal air to reach areas east of the Rockies, particularly later in the winter. The agreement between two independent seasonal models makes this a signal worth monitoring closely.
This is not a forecast for repeated major snowstorms or Nor’easters. The pressure pattern could improve access to cold air, but snow would still require that cold to arrive before or during a favorably tracked storm. Storm timing, coastal redevelopment, low-level temperatures, and the shorter-lived AO, EPO, PNA, and NAO patterns will remain critical.
December
Both models already show lower pressure in the Gulf of Alaska during December, while the eastern Canada blocking signal is present but less developed. Much of the East may still struggle to maintain cold air long enough for widespread snow.
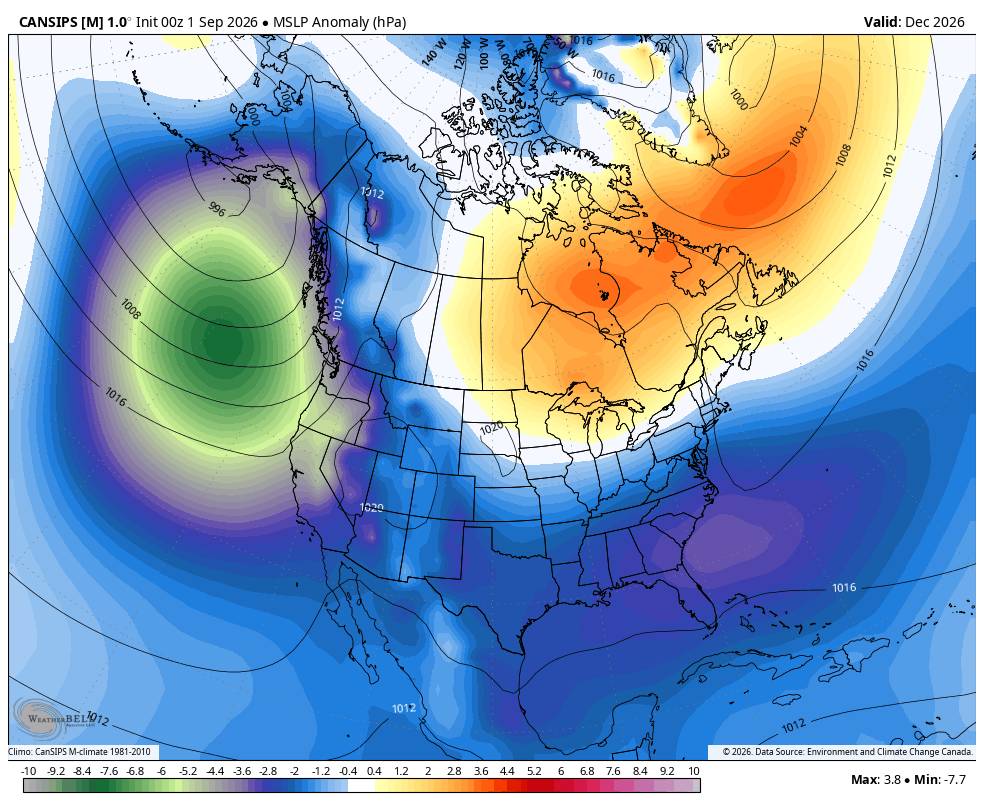
CANSIPS December 2026 mean sea-level pressure anomalies. Blue and green indicate lower-than-normal pressure; orange and red indicate higher-than-normal pressure. Source: Environment and Climate Change Canada, displayed by WeatherBell Analytics.
CANSIPS December 2026 mean sea-level pressure anomalies showing a Gulf of Alaska trough and higher pressure across Canada.
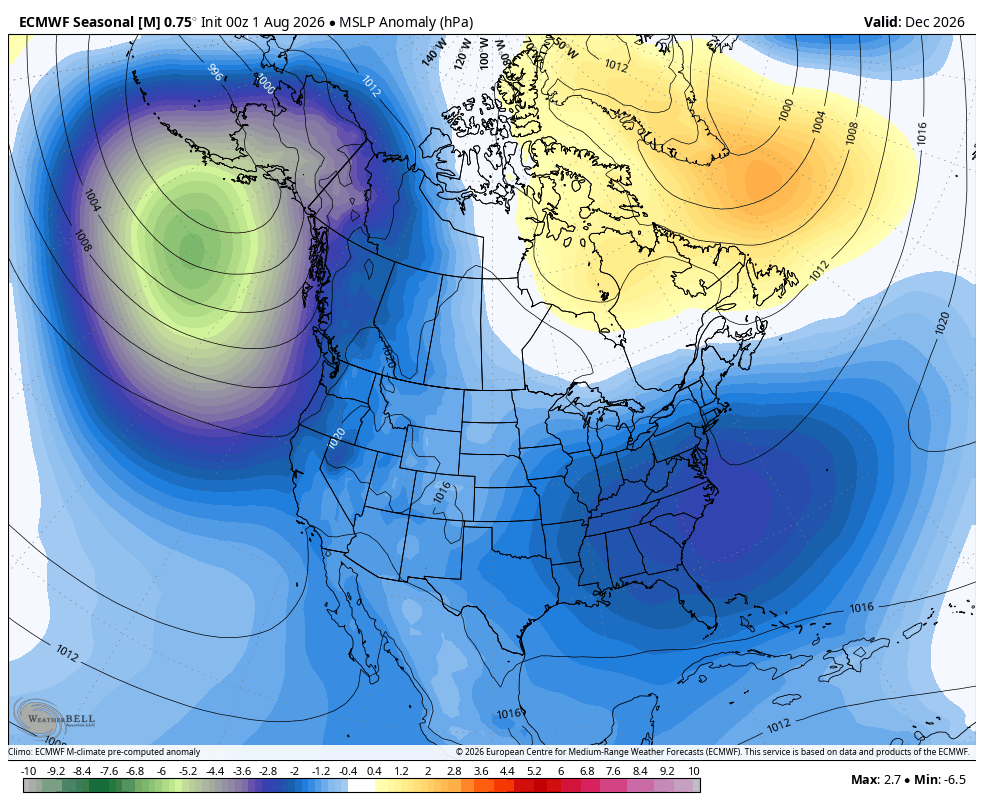
ECMWF Seasonal December 2026 mean sea-level pressure anomalies. Source: ECMWF, displayed by WeatherBell Analytics.
ECMWF Seasonal December 2026 mean sea-level pressure anomalies showing lower pressure near Alaska and higher pressure across northern Canada.
January
By January, the Gulf of Alaska trough deepens, and the higher-pressure anomaly over eastern Canada becomes more prominent in both models. This is the first month in which the background pattern offers a more meaningful opportunity for cold air to overlap with the active southern storm track.
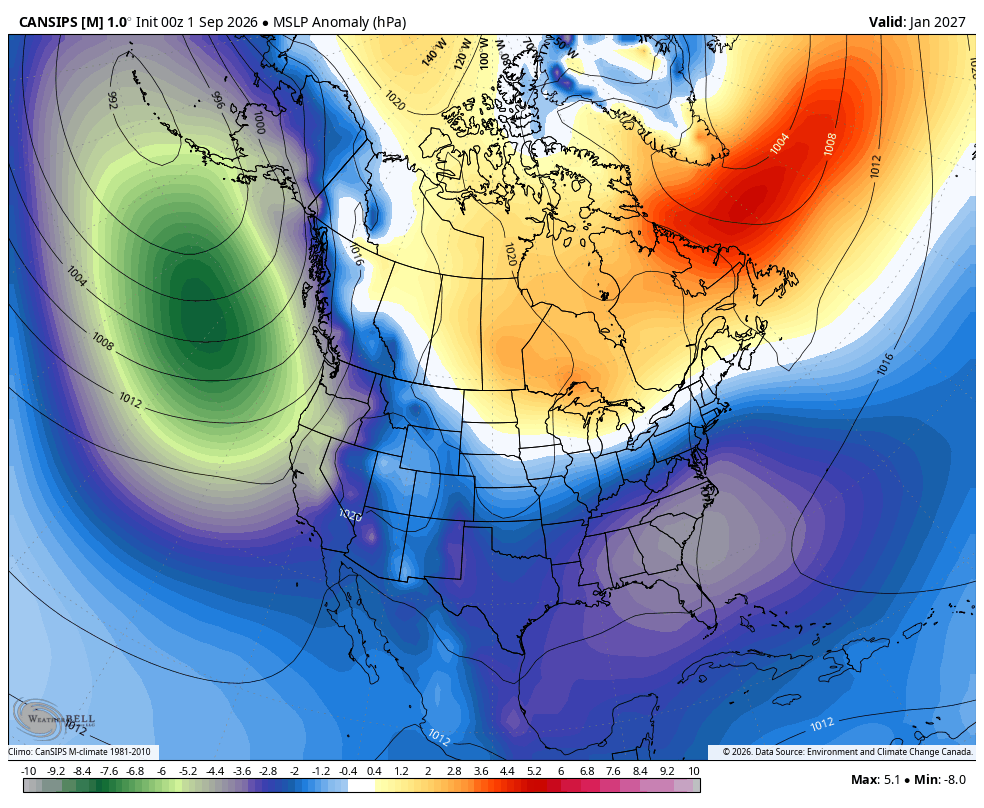
CANSIPS January 2027 mean sea-level pressure anomalies. Source: Environment and Climate Change Canada, displayed by WeatherBell Analytics.
CANSIPS January 2027 mean sea-level pressure anomalies showing a stronger Gulf of Alaska trough and eastern Canada blocking.
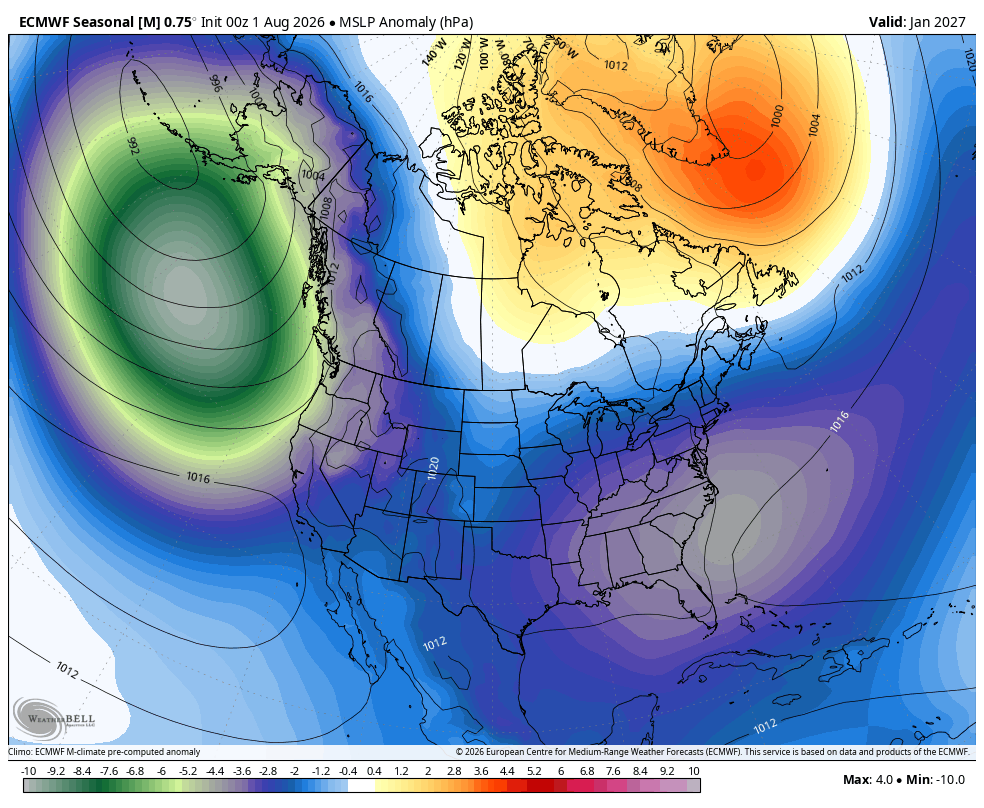
ECMWF Seasonal January 2027 mean sea-level pressure anomalies. Source: ECMWF, displayed by WeatherBell Analytics.
ECMWF Seasonal January 2027 mean sea-level pressure anomalies showing a stronger Gulf of Alaska trough and eastern Canada blocking
February
The pattern is strongest in February. Both models maintain a deep Gulf of Alaska trough and place a broad blocking high across eastern Canada. This supports a warmer West Coast and increases the chance of below-normal temperatures across much of the country east of the Rockies. It also reinforces February as an important Eastern winter-weather window, but it does not guarantee that a storm will be present when the cold air is available.
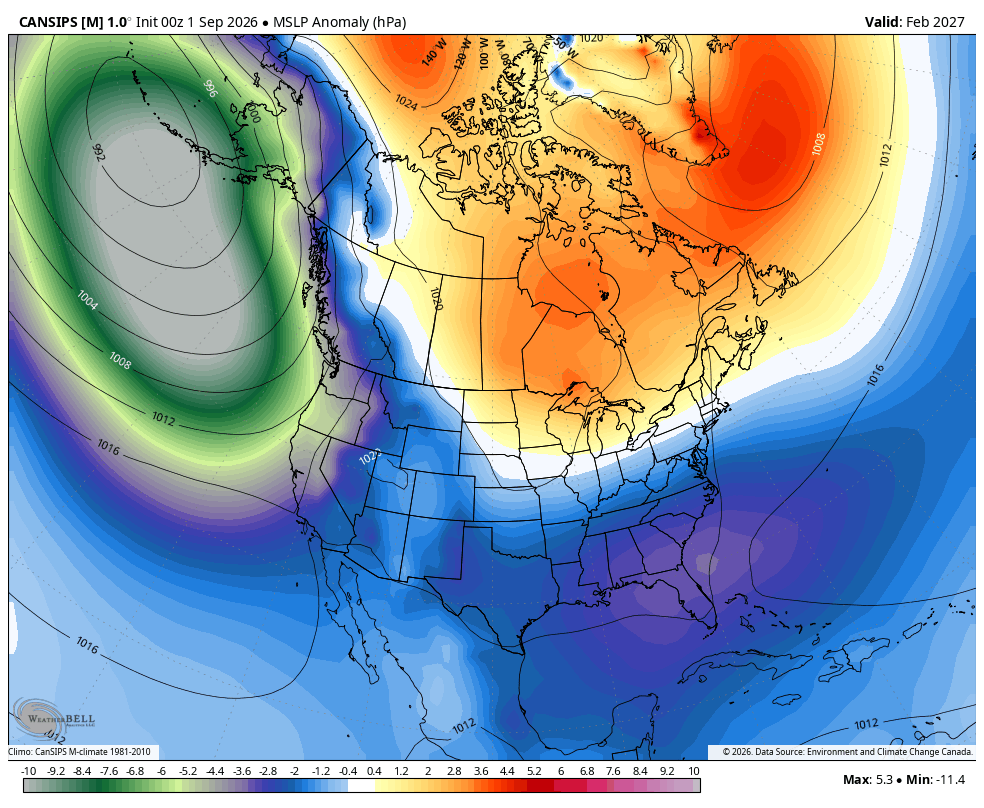
CANSIPS February 2027 mean sea-level pressure anomalies. Source: Environment and Climate Change Canada, displayed by WeatherBell Analytics.
CANSIPS February 2027 mean sea-level pressure anomalies showing a deep Gulf of Alaska trough and strong eastern Canada blocking.
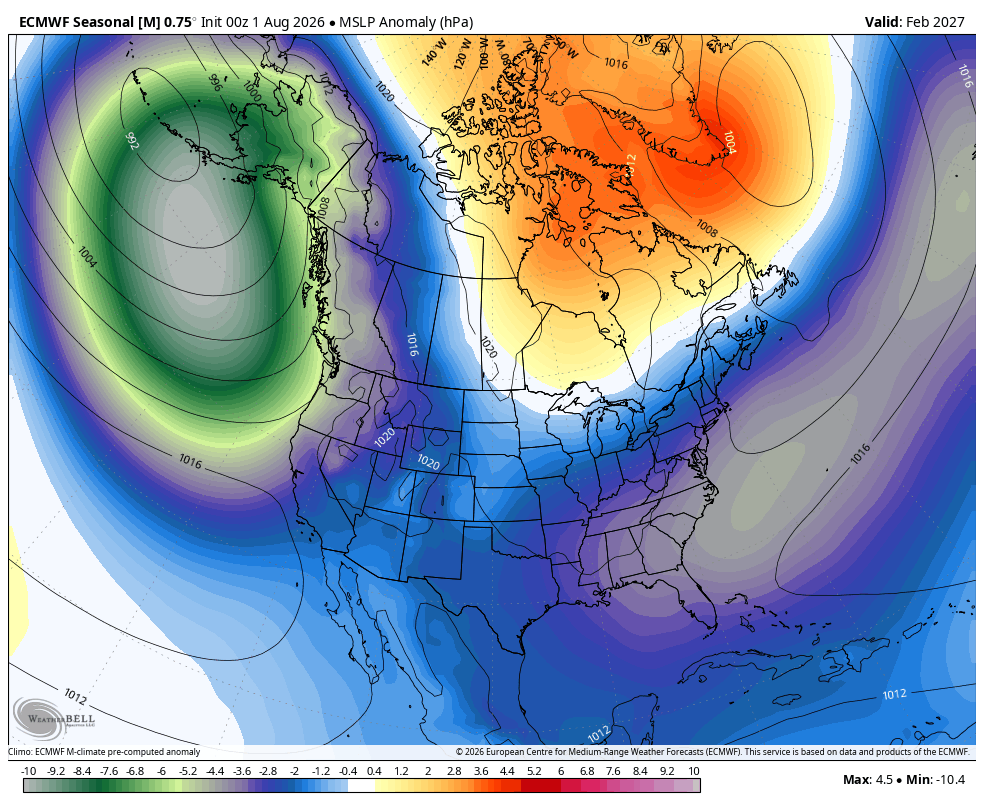
ECMWF Seasonal February 2027 mean sea-level pressure anomalies. Source: ECMWF, displayed by WeatherBell Analytics.
ECMWF Seasonal February 2027 mean sea-level pressure anomalies showing a deep Gulf of Alaska trough and strong eastern Canada blocking.
HISTORICAL ANALOGS AND SEASONAL POSSIBILITIES
The four primary very strong El Niño analog seasons used in this outlook remain 1982-1983, 1997-1998, 2015-2016, and 2023-2024. The August ranking places 2015-2016 first by a considerable margin, followed by 1997-1998, 1982-1983 and 2023-2024. Each produced an active southern storm track, but their snowfall distributions differed considerably because cold air and moisture did not overlap in the same places or at the same times.
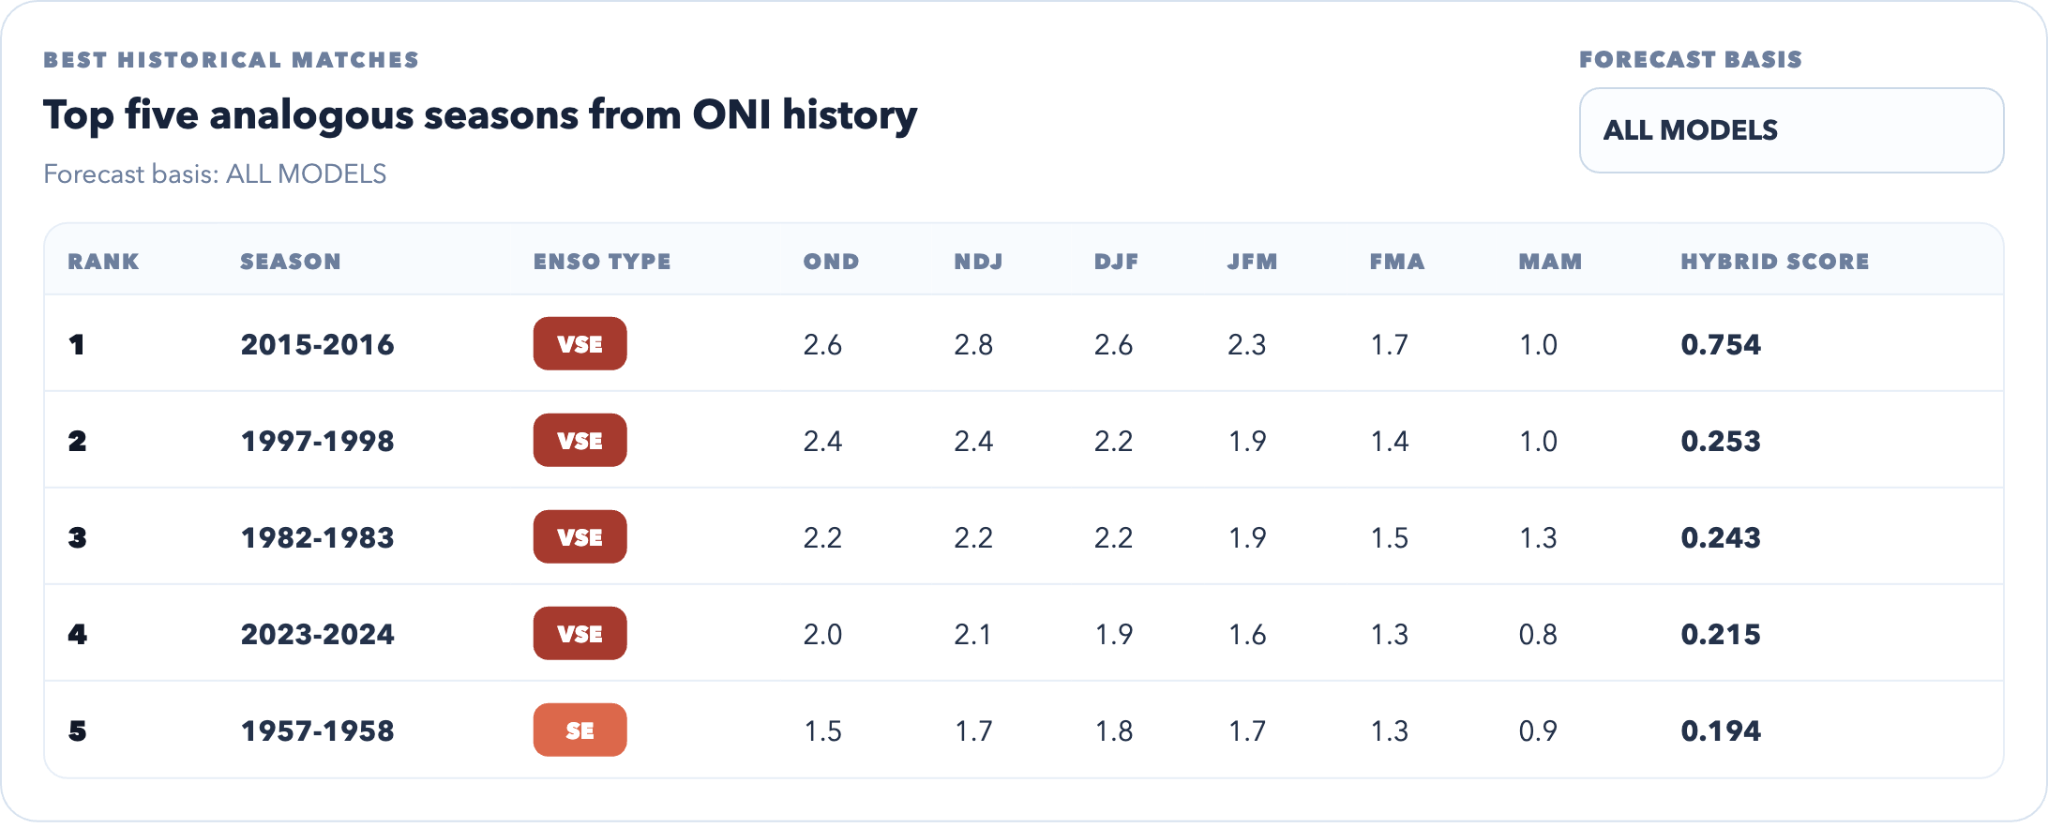
Top five analogous ENSO seasons using the August 2026 all-model forecast and ONI history. VSE denotes very strong El Niño; SE denotes strong El Niño. Source: trueWeather analog tool.
The current all-model forecast is stronger than every selected analog from October through March. That does not make the historical seasons less useful, but it does mean none should be treated as a direct blueprint. The analogs are most valuable for identifying recurring regional tendencies and the atmospheric changes that created important exceptions.
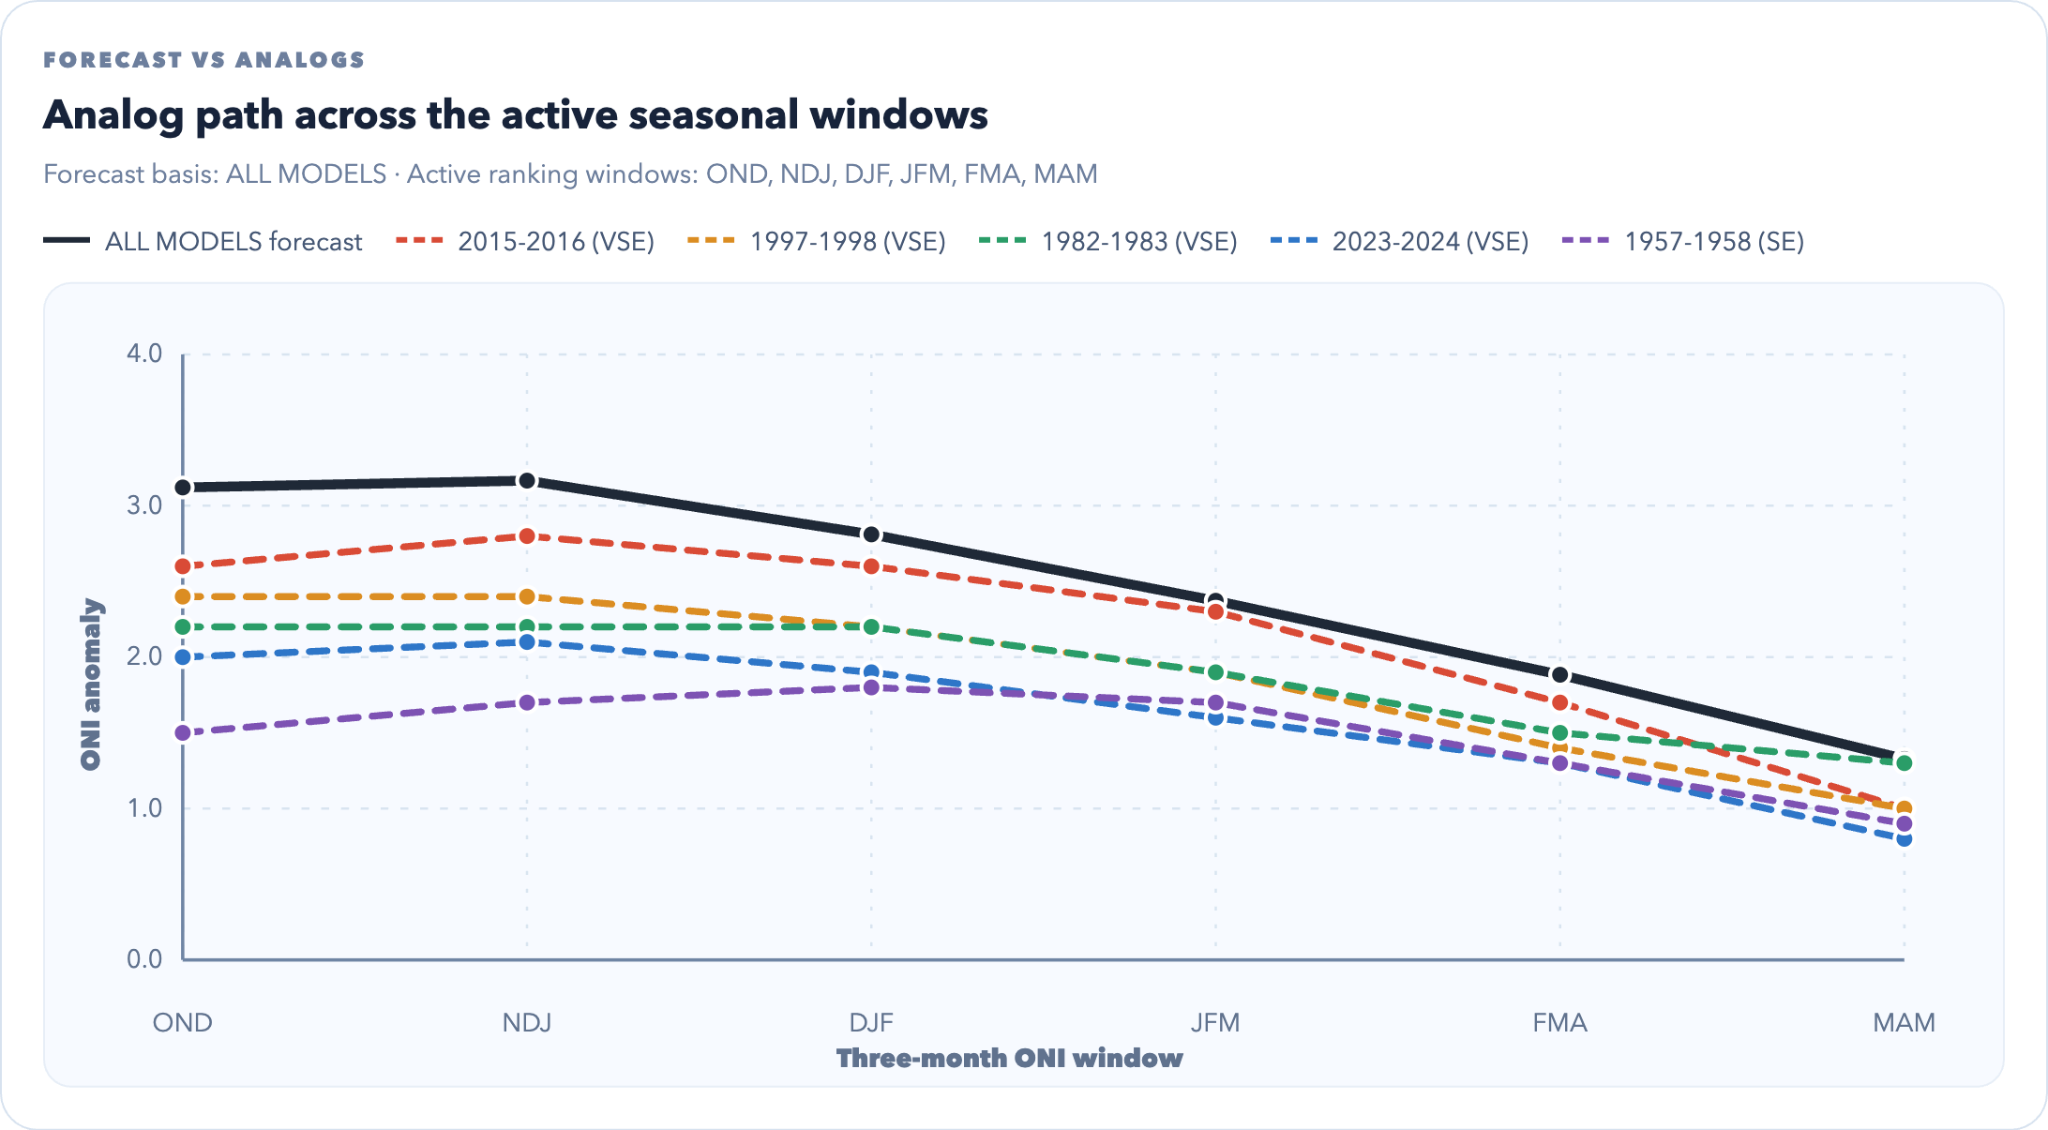
August 2026 all-model ENSO forecast compared with the five closest historical ONI paths across the seasonal windows. Source: trueWeather analog tool.
1982-1983
The winter was very warm and stormy overall. Many Mid-Atlantic systems produced rain, but a brief negative-AO cold window allowed the February 10-12 storm to become a major East Coast snowstorm. The lesson is that a short period of cold access can convert an otherwise warm and wet pattern into a major snow event.
1997-1998
The southern tier was extremely active and wet, but the winter was generally poor for widespread Northeast snow. Major Appalachian snow and a historic northern ice storm demonstrated that abundant moisture can be displaced from the primary snow corridor or expressed as rain and ice.
2015-2016
Record warmth dominated December before a short January cold window opened. The January 22-24 Nor’easter then produced a major snowfall from the Mid-Atlantic into parts of the Northeast. In several locations, that single storm accounted for a large portion of the entire season’s snow.
2023-2024
The northern tier and Great Lakes remained warm, and cold intrusions were often poorly phased with the primary moisture plume. The February 27-28 system illustrated this failure mode well: heavy rain and severe weather arrived first, followed by a dramatic temperature drop after the deepest moisture and strongest lift had departed.
Why 1957-1958 is different
The 1957-1958 winter was a strong El Niño, not a very strong El Niño, and it is excluded from the four-season temperature and precipitation composites in this outlook. It remains a useful secondary comparison because the AO broke down and opened a broader, more persistent window for cold air to reach the East.
That longer cold window allowed southern-stream moisture to overlap with cold air on multiple occasions, producing a much snowier outcome. Its value is in showing the importance of cold-air duration and repeated favorable timing, not in treating 1957-1958 as a direct analog for 2026-2027.
TYPICAL ANALOG SNOWFALL OUTLOOK
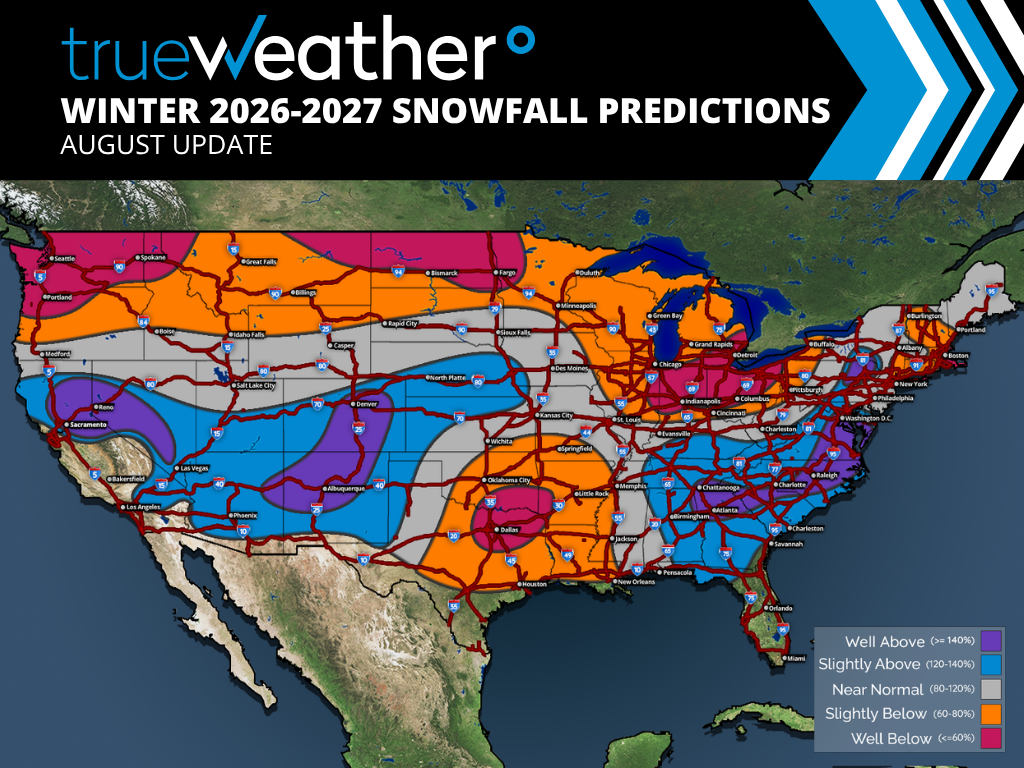
The snowfall signal is not equally predictable everywhere. The Northwest, northern Plains, Upper Midwest, and much of the Great Lakes show less disagreement among the very strong El Niño analogs. Coastal portions of the northern Mid-Atlantic through southern New England show much greater volatility because one short overlap between cold air, Atlantic moisture, and a favorably positioned coastal low can determine the seasonal result.
- Northwest: Below-normal snow is favored at lower elevations, with a mixed outcome in the higher terrain.
- Southwest: The most favorable mountain-snow corridor, although elevation and temperature remain critical.
- North Central: The strongest and most consistent below-normal signal is centered across the northern Plains, Upper Midwest, and Great Lakes.
- South Central: Snow is favored below normal in most lowland locations, but ice can become a meaningful risk when shallow cold air becomes established.
- Northeast: Below-normal snowfall is favored overall, with greater upside from the northern Mid-Atlantic into the coastal Northeast if a major storm develops.
- Southeast: Absolute snowfall remains low, but the Appalachians and portions of the Carolinas have a better opportunity if cold air arrives at the right time.
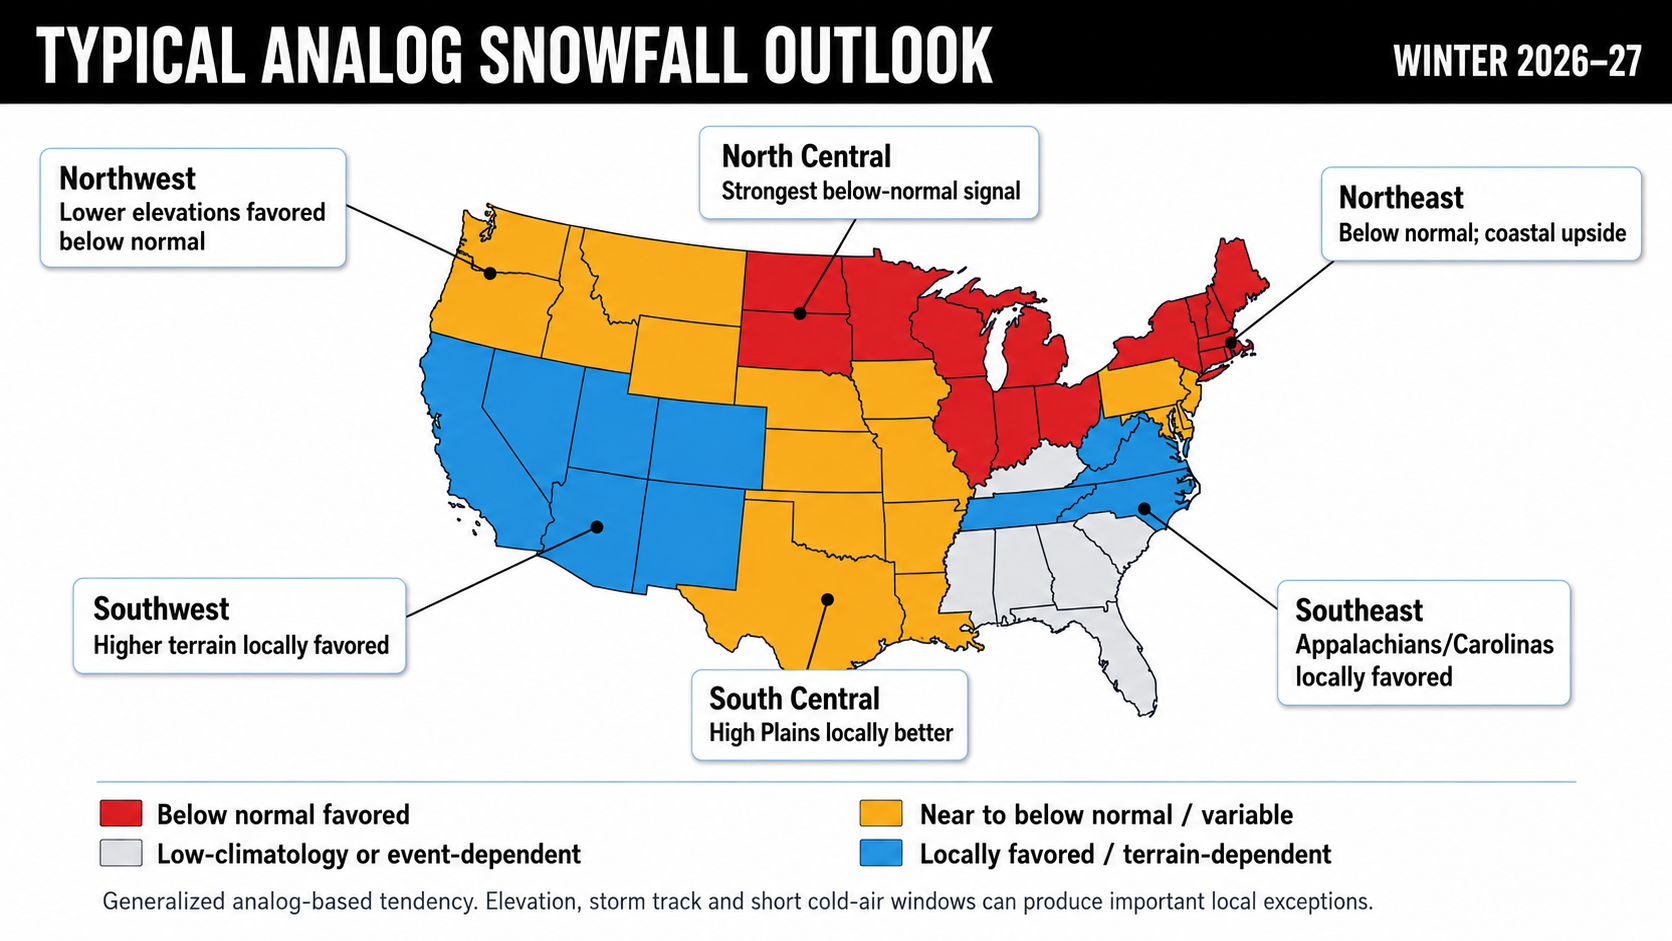
Generalized snowfall tendency based on the four primary very strong El Niño analog seasons and the regional outlook framework. Blue identifies areas with the best local, elevation-driven or storm-track-dependent upside; it does not imply above-normal snow throughout every shaded state.
BEST WINDOW FOR SNOWFALL
Snowfall opportunity is not expected to be distributed evenly throughout the winter. December offers the best early opportunity from the central Plains into the Upper Midwest. January becomes the primary window across the South and Southeast, while January and February carry the greatest opportunity in the Southwest and East.
March remains a conditional extension of the Eastern window rather than the base case. The Northwest has a broader December-through-February opportunity because its outcome depends more on individual Pacific systems, elevations, and snow levels than on one favored month.
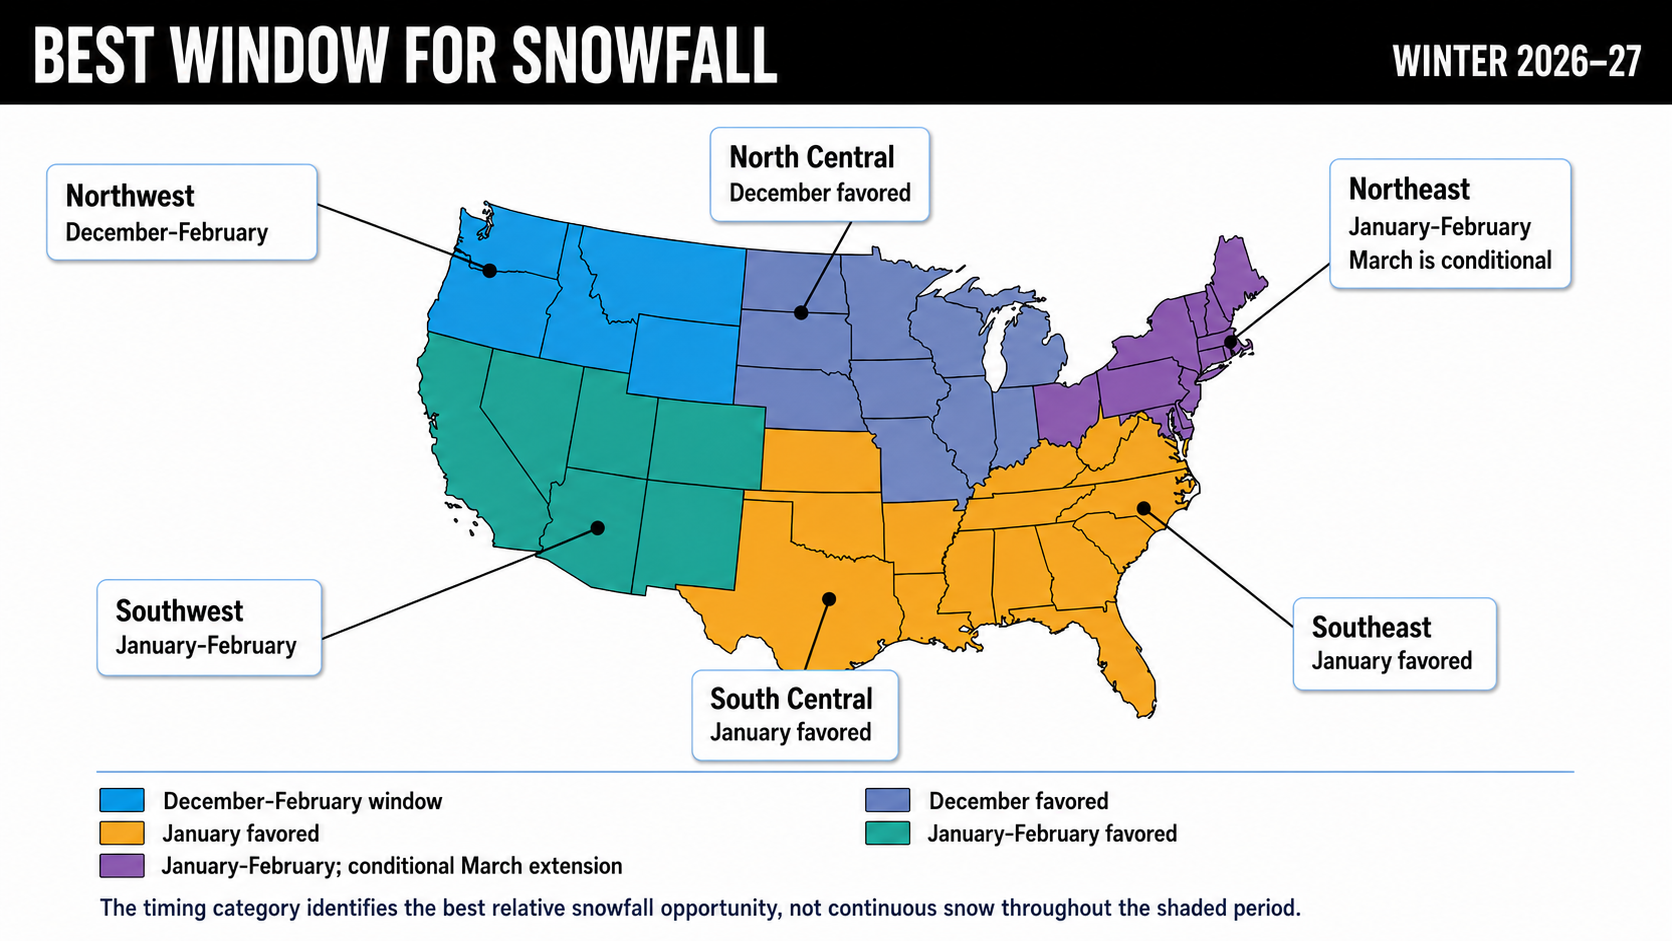
Most likely timing of the best snowfall opportunity within the very strong El Niño analog framework.
TEMPERATURE TRENDS IN VERY STRONG EL NIÑO WINTERS
The December-through-February composite favors persistent warmth from the Northwest and North Central states through the Great Lakes and Northeast. The southern tier averages closer to normal, while the Southwest retains the most durable relative cool signal.
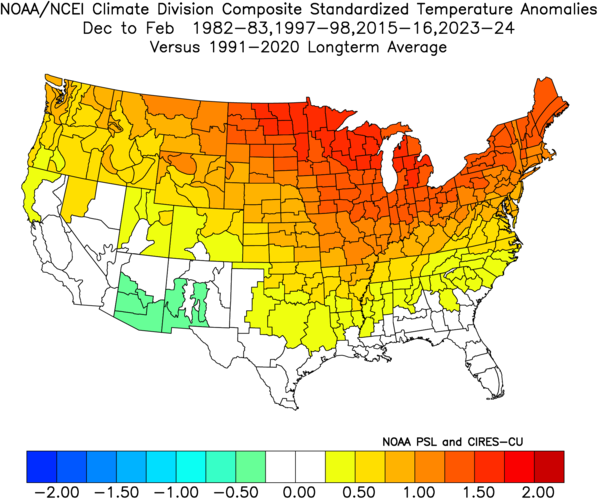
December-February standardized temperature anomalies for 1982-1983, 1997-1998, 2015-2016 and 2023-2024 versus the 1991-2020 average. Source: NOAA/NCEI composite graphic.
December
The Southwest is the primary relative cool pocket, especially Arizona and New Mexico, while much of California and Nevada remains closer to normal. The South, Mid-Atlantic, North Central states, Great Lakes and Northeast generally begin the winter warm. That warmth reduces the likelihood that the active early storm pattern produces widespread snow.
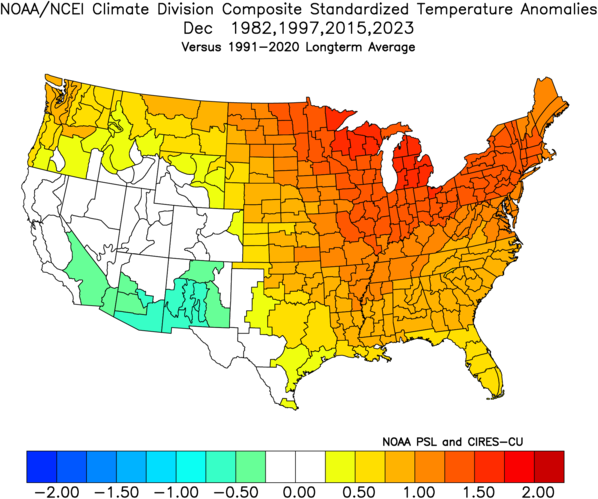
December standardized temperature anomalies for 1982, 1997, 2015 and 2023 versus the 1991-2020 average. Source: NOAA/NCEI composite graphic.
January
The cool signal expands from the Southwest across the southern Plains, Gulf states and core Southeast. This creates the winter’s best broad opportunity for cold air to overlap with the active southern storm track. Virginia and the southern Mid-Atlantic sit near the northern edge of that cooler corridor and remain an important transition zone.
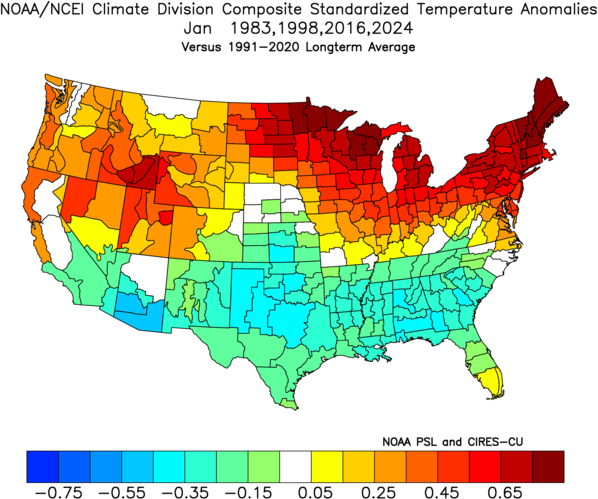
January standardized temperature anomalies for 1983, 1998, 2016 and 2024 versus the 1991-2020 average. Source: NOAA/NCEI composite graphic.
February
The broad January southern cool signal weakens substantially. Much of the Southwest, South Central and Southeast trends closer to normal or slightly warm, while warmth intensifies from the northern Plains through the Great Lakes and Upper Midwest. The Northeast also remains warm in the monthly composite, meaning any major coastal snowstorm would require a short cold delivery that a monthly average cannot resolve.
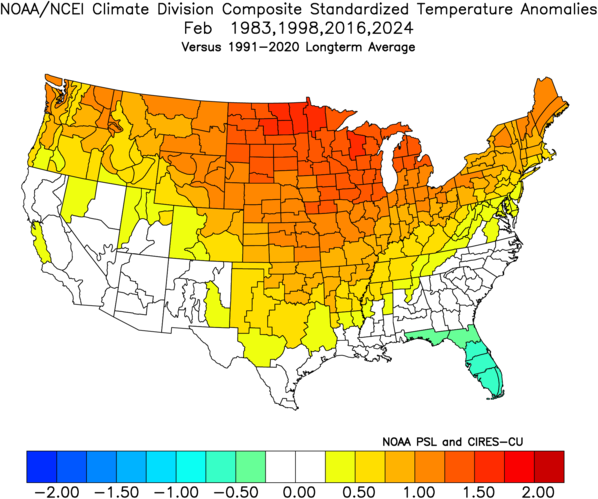
February standardized temperature anomalies for 1983, 1998, 2016 and 2024 versus the 1991-2020 average. Source: NOAA/NCEI composite graphic.
PRECIPITATION TRENDS IN VERY STRONG EL NIÑO WINTERS
The Southeast is the clearest and most persistent wet region in the December-through-February composite. Portions of the West and central Plains also average modestly wet, while the Upper Ohio Valley remains comparatively weak.
The seasonal mean, however, hides a notable central United States reversal. A broad precipitation maximum develops in December from the southern and central Plains through the mid-Mississippi Valley and Upper Midwest, then contracts sharply during January and February.
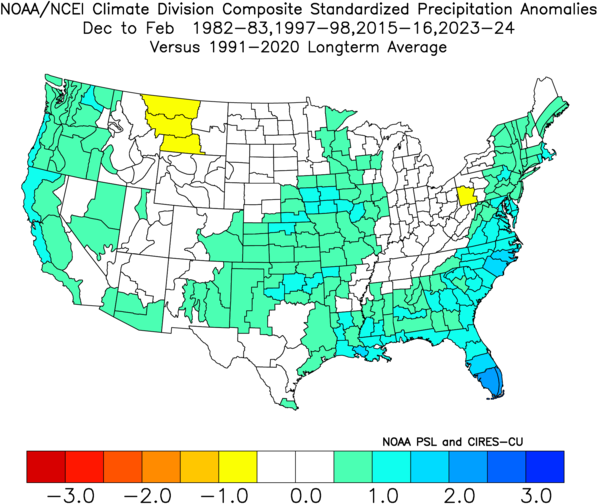
December-February standardized precipitation anomalies for 1982-1983, 1997-1998, 2015-2016 and 2023-2024 versus the 1991-2020 average. Source: NOAA/NCEI composite graphic.
December
A broad and unusually strong wet axis extends from the southern and central Plains through the mid-Mississippi Valley and into the Upper Midwest. The Southeast and Atlantic coastal corridor are already active, while Nevada, Utah, and portions of the interior West begin drier. This is an early precipitation signal, not an automatic early-snow signal, because much of the country also begins the season warm.
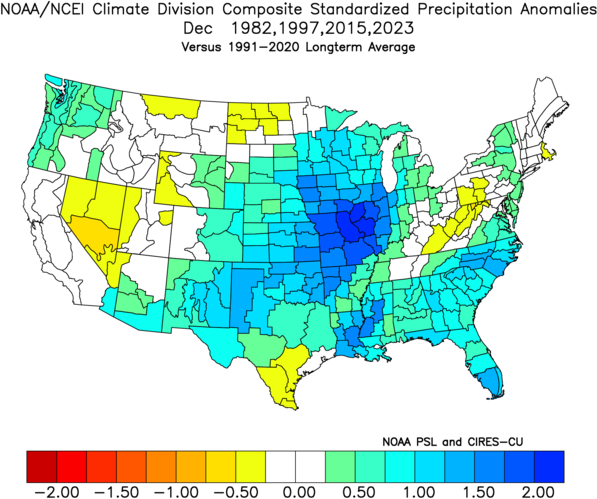
December standardized precipitation anomalies for 1982, 1997, 2015 and 2023 versus the 1991-2020 average. Source: NOAA/NCEI composite graphic.
January
The December central precipitation maximum disappears quickly. The northern Rockies, northern Plains and parts of the central interior turn drier, while the Pacific Northwest, Gulf Coast, Southeast and much of the Atlantic corridor retain or gain precipitation opportunity. The Upper Ohio Valley remains weak, reinforcing a poor foundation for routine snowfall.
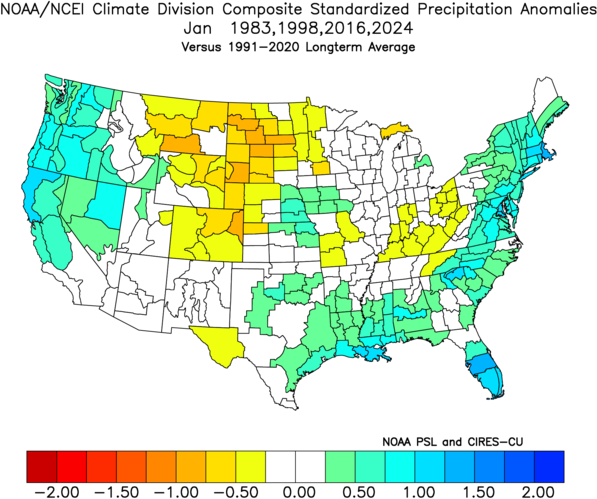
January standardized precipitation anomalies for 1983, 1998, 2016 and 2024 versus the 1991-2020 average. Source: NOAA/NCEI composite graphic.
February
California, Nevada and much of the Southwest improve as the season progresses, while the Southeast and Atlantic coast remain persistently wet. The mid-Mississippi Valley, Midwest and Great Lakes become comparatively quiet. This reduces central snowfall opportunities but preserves moisture for a high-impact East Coast event if a short cold window develops.
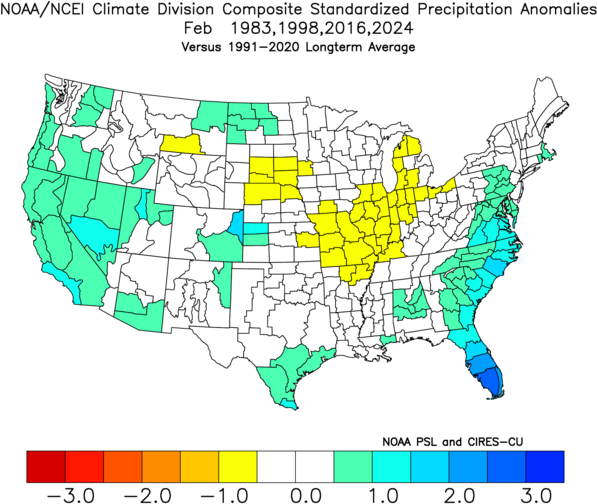
February standardized precipitation anomalies for 1983, 1998, 2016 and 2024 versus the 1991-2020 average. Source: NOAA/NCEI composite graphic.
REGIONAL WINTER OUTLOOK
NORTHWEST
| Baseline Snow | Below normal at lower elevations; mixed in the higher terrain |
|---|---|
| Overall Confidence | Moderate to high in the regional pattern; lower for individual mountain basins |
| Primary Window | December through February, especially when cold air arrives before a Pacific system |
| Primary Hazard | Warm rain, lower snow-to-liquid ratios, strong winds and flooding |
Washington, Oregon, Idaho and the northern Rockies remain on the warm side of the very strong El Niño pattern. The deepening Gulf of Alaska trough shown by CANSIPS and ECMWF Seasonal strengthens the case for warmer flow along the West Coast as winter progresses. The Pacific Northwest is not uniformly dry and can turn wetter during January, but warmer conditions keep snow levels elevated and allow a larger share of the precipitation to fall as rain at lower and middle elevations.
What could create an exception: Cold continental air becoming established before an atmospheric river or strong Pacific wave, a temporary eastern-Pacific trough or repeated high-elevation storms with snow levels remaining below the major passes.
SOUTHWEST
| Baseline Snow | Near to above normal in favored higher terrain; mixed at lower elevations |
|---|---|
| Overall Confidence | Moderate; confidence in increased precipitation is higher than confidence in snowfall |
| Primary Window | January and February |
| Primary Hazard | Heavy mountain snow, flooding risk and strong winds |
California, Arizona, New Mexico, southern Nevada, Utah and the southern Rockies lie closer to the strengthened subtropical jet. Nevada and parts of the interior Southwest begin December on the drier side, while California and much of the region improve during January and February.
The higher terrain of Arizona and New Mexico and portions of the southern Rockies can perform well when the storm track remains active. Lower elevations may receive substantial precipitation without a corresponding increase in snow.
What could create an exception: Repeated eastern-Pacific troughs, sufficient cold to keep snow levels low during the wettest systems and storm paths that repeatedly cross the Sierra, Mogollon Rim, and southern Rockies.
NORTH CENTRAL
| Baseline Snow | Well below normal north and east; closer to normal across Iowa and the southern fringe |
|---|---|
| Overall Confidence | Moderate to high north of the primary storm track |
| Primary Window | December offers the best early opportunity; January and February are generally quieter |
| Primary Hazard | Fewer storms, brief cold snaps, strong winds and isolated lake-effect bursts |
The northern Plains, Upper Midwest and much of the Great Lakes remain on the warm side of the analog pattern. A pronounced December precipitation surge fades sharply during January and February, leaving fewer sustained snow and lake-effect opportunities. The developing eastern Canada block could provide periodic late-winter cold, but colder conditions would still need to overlap with a storm in a region where the precipitation signal is comparatively weak.
Iowa and the southern transition zone retain more upside when the early moisture overlaps with available cold air. Farther north, the below-normal snowfall signal is more stable among the analog seasons.
What could create an exception: A negative AO and positive PNA combination delivering sustained cold, phasing between the northern and southern streams, or a storm track through the Ohio or Tennessee Valley instead of the central Great Lakes.
SOUTH CENTRAL
| Baseline Snow | Below normal in most lowland locations; locally better toward the High Plains |
|---|---|
| Overall Confidence | Moderate for wetness; low to moderate for precipitation type |
| Primary Window | January, with shorter icing windows whenever shallow cold becomes established |
| Primary Hazard | Cold rain, freezing rain, sleet, flash flooding and severe weather |
Texas, Oklahoma, Arkansas, Louisiana and the lower Mississippi Valley remain close to the active southern jet but are often too warm for widespread snow. Dallas and other lowland locations can receive substantial winter precipitation while finishing with limited snowfall.
Oklahoma, the Texas Panhandle and higher terrain have a better opportunity when cold air arrives. Because that cold is often shallow, freezing rain and sleet may become more important than snow totals.
What could create an exception: A strong surface high driving subfreezing air southward, a negative AO supplying cold before a southern wave arrives or persistent overrunning above an entrenched shallow cold layer.
NORTHEAST
| Baseline Snow | Below normal overall, with the northern Mid-Atlantic carrying the best upside |
|---|---|
| Overall Confidence | Moderate in the milder baseline; low in the final seasonal snowfall total |
| Primary Window | January and February, with a conditional extension into March |
| Primary Hazard | Heavy snow, mixed precipitation, strong winds, and coastal flooding |
The Upper Ohio Valley and eastern Great Lakes are favored below normal because warmth limits lake-effect snow and the regional precipitation signal is weaker. The northern Mid-Atlantic through New York City carries the best upside from the southern storm track, but its seasonal snowfall total may depend heavily on one storm.
Southern New England is also favored below normal, while northern New England remains more dependent on elevation and the precise storm track. This is the region where seasonal-total risk and maximum-event risk diverge most sharply.
The August CANSIPS and ECMWF Seasonal guidance increases the need to watch January and February, especially February, for a colder Eastern window. A strengthening block over eastern Canada may help cold air remain available longer than it did during many of the primary analog winters. That possibility raises the ceiling for an individual event without guaranteeing above-normal seasonal snowfall.
What could create an exception: A negative AO and EPO delivering cold before a southern-stream storm, a positive PNA and negative NAO establishing a colder and slower Eastern pattern, and a southeastern-Canada high supporting coastal redevelopment near the Mid-Atlantic.
SOUTHEAST
| Baseline Snow | Low in absolute terms; locally favored in the Appalachians and Carolinas |
|---|---|
| Overall Confidence | Moderate for an active wet pattern; low for individual snow and ice corridors |
| Primary Window | January, with a conditional extension into February if cold-air damming develops |
| Primary Hazard | Heavy rain, freezing rain, Appalachian snow and enhanced cool-season severe weather |
The Carolinas, Tennessee, Georgia, and Florida form the most consistently wet corridor in the precipitation composite. The southern Appalachians and portions of the Carolinas can benefit from the increased number of southern-stream systems, but widespread lowland snow remains difficult because deep cold is often absent.
The region begins warm in December, turns cooler in January, and moderates in February. Virginia and the southern Mid-Atlantic remain a transition zone where cold-air damming can produce a different outcome than the core Southeast.
If the eastern Canada block develops as currently projected, late-winter cold-air damming and mixed-precipitation opportunities could become more frequent along and east of the Appalachians. The active southern storm track would still need to arrive while the cold air remains in place.
What could create an exception: Cold-air damming east of the Appalachians, a negative AO supplying cold before Gulf moisture arrives, a low tracking along the Gulf Coast and offshore of the Carolinas, or persistent overrunning after the low-level cold wedge becomes established.
WHAT COULD OPEN A MAJOR EAST COAST SNOWSTORM WINDOW?
The August seasonal guidance adds a potentially important background ingredient: both CANSIPS and ECMWF Seasonal strengthen a blocking high over eastern Canada during January and February. That could improve the availability and durability of cold air across the East, but a major East Coast snowstorm would still require several ingredients to align within a relatively short period:
- Cold becomes accessible. A negative AO, potentially reinforced by a negative EPO, allows Arctic or continental air to move into the central and eastern United States.
- The North American pattern amplifies. A positive PNA favors a western ridge and downstream eastern trough.
- Blocking slows the storm. A negative NAO, the projected eastern Canada high or another well-positioned high-latitude block suppresses and slows the coastal system without forcing it too far south.
- A southern-stream disturbance arrives on time. The active El Niño jet supplies moisture and lift while the cold air is already established.
- The surface pattern cooperates. A high over southeastern Canada, cold-air damming and a coastal or offshore storm track prevent low-level warming from changing snow to rain.
This combination developed briefly during February 1983 and January 2016. It did not develop during many other wet systems in the analog winters, which is why an active storm track can coexist with below-normal seasonal snowfall.
OUTLOOK SUMMARY
- A very strong El Niño remains the dominant background signal, favoring a warmer northern tier and an active southern storm track.
- The August all-model ENSO forecast peaks near +3.1°C to +3.2°C and remains stronger than the selected analog paths through most of the active seasonal windows.
- CANSIPS and ECMWF Seasonal both strengthen a Gulf of Alaska trough and eastern Canada blocking high as winter progresses, supporting West Coast warmth and increasing the potential for colder conditions east of the Rockies.
- The most stable below-normal snowfall signal is centered across the northern Plains, Upper Midwest, and Great Lakes.
- The Southwest has the strongest broad opportunity for increased mountain snowfall, especially during January and February, but elevation and snow levels remain critical.
- The South Central and Southeast regions are favored wetter, with January offering the best opportunity for snow or ice when cold air becomes available.
- The Northeast is favored below normal overall, but the northern Mid-Atlantic through southern New England retains greater volatility because one major Nor’easter can materially change the seasonal result.
- January and February carry more Eastern winter-weather risk than November and December, with February becoming especially important if the projected blocking pattern develops. March remains a conditional extension rather than the primary expectation.
This August outlook communicates the favored seasonal background and the conditions that could create important exceptions. It is not a storm-specific forecast or a guarantee of seasonal snowfall. The outlook will be refined as autumn snow cover, ocean-atmosphere coupling, and shorter-range climate signals become clearer.
SOURCES
- NOAA Climate Prediction Center ENSO Diagnostic Discussion
- International Research Institute ENSO Forecast
- NOAA Ocean Service overview of El Niño and the U.S. winter jet stream
- NOAA Climate Prediction Center Arctic Oscillation monitoring
- NOAA Climate Prediction Center Pacific-North American pattern monitoring
- NOAA Climate Prediction Center North Atlantic Oscillation monitoring
- National Weather Service summary of the February 10-12, 1983 Nor’easter
- NOAA/NWS service assessment of the January 2016 Nor’easter
- National Weather Service summary of the February 27-28, 2024 storm and temperature crash
- Environment and Climate Change Canada CANSIPS seasonal mean sea-level pressure anomaly guidance
- ECMWF Seasonal mean sea-level pressure anomaly guidance